


Powered by the real-time trading data in our CIX VCM Trade Database, the CIX Intelligence 2025 Market Pulse condenses thousands of daily price points into signals market participants need to navigate an evolving voluntary carbon landscape.
Disclaimer: This following analysis reflects a subset of market activity and is intended for indicative purposes only.
This edition of CIX’s Market Pulse delivers a full-year assessment of the voluntary carbon market, examining how trading activity, liquidity and pricing evolved through 2025. Insights are drawn from observable market activity (bids, offers and transactions), combined with benchmark behaviour, to assess how buyer behaviour, supply dynamics and integrity filters shaped the market over the year.
CREDIT TYPE ACTIVITY TRENDS
MARKET TRENDS BY PROJECT TYPE
Nature-based project types
REDD+
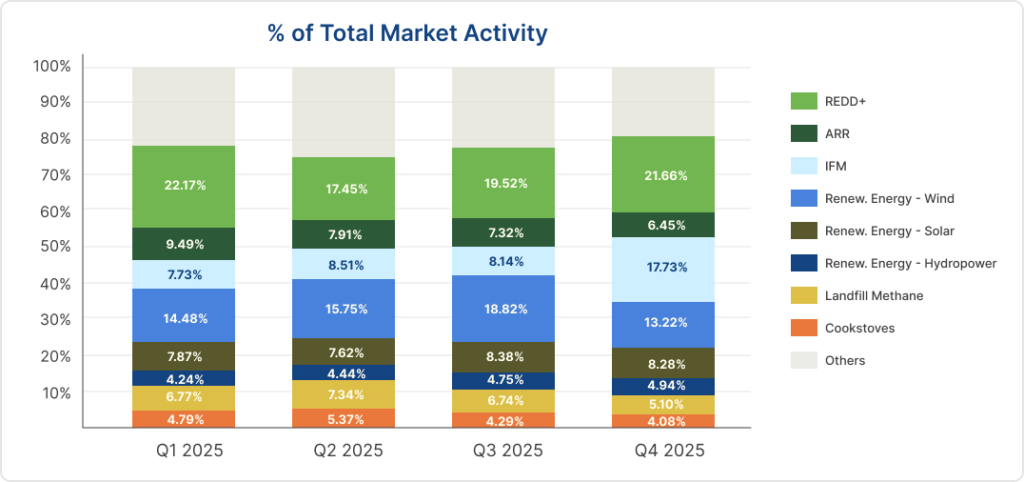
REDD+ remained the most actively quoted and traded category in 2025, but its share of activity* continued to erode.
REDD+ accounted for 22.17% of activity in Q1, fell sharply to 17.45% in Q2, before ending the year at 21.66% by Q4. The downward movement of REDD+’s share of activity mirrors the longer-term decline observed in 2024, when REDD+ dropped from 43.84% of activity in Q1 to 28.58% by year-end. Overall, this trend is reflective of a shift away from REDD+.
Over 60% of the volume was traded** in the first half of the year, with more than 40% occurring in Q1 alone. This reflects concentrated buying activity by a few large energy corporates who traded in high volumes in Q1.
ARR (Afforestation, Reforestation and Revegetation)
Recorded ARR activity fell quarter-over-quarter through 2025, from 9.49% in Q1 to 6.45% by year-end. This potentially reflects a gradual shift away from secondary market trading in favor of long-term offtake agreements.
Nearly 80% of ARR volume was traded in H1.
IFM (Improved Forest Management)
In contrast, IFM gained momentum over the year. It started the year at 7.73% of activity, surpassed ARR in Q2 and then accelerated sharply in Q4, rising from 8.14% to 17.73%. This aligns with the ICVCM’s full approval of Climate Action Reserve’s Mexico Forest Protocol for Core Carbon Principles (CCP) eligibility at the end of Q3***.
IFM was the fourth most traded category in 2025, behind REDD+, solar and wind energy.
Industrial project types
Renewable Energy
Renewable energy (aggregating Wind, Solar and Hydropower – the most active renewable energy types), made up 26-32% of market activity over 2025.
Renewable energy’s share of activity started the year at 26.59%, before rising in Q2 and Q3. By Q4, activity had dropped back to Q1 levels, reinforcing renewable energy’s steady demand and supply levels.
Within renewable energy, solar accounted for the highest volume of trades and generally saw the lowest-priced offers.
Landfill methane
Landfill methane activity surpassed cookstoves in 2025 by roughly 2%p each quarter, flipping 2024’s trend and reflecting the market’s growing demand for quantifiable credits with potential for CCP labelling.
Momentum built through 2024, when landfill methane activity rose from 1% in Q1 to 6% by Q4. In 2025, quoting activity reached a peak in Q2 at 7.3%, then slowed in the last two quarters of the year.
HFC refrigerant destruction
Although HFC refrigerant destruction credits represented less than 2% of visible market activity, they ranked among the top five credit types by traded volume in 2025.
Market activity was heavily backloaded, with H2 seeing 65% more volumes than H1, again reflecting the market’s growing demand for quantifiable credits (though HFC methodologies have not been fully reviewed for CCP approval by ICVCM yet).
CIX BENCHMARK MOVEMENTS
CIX CORSIA X
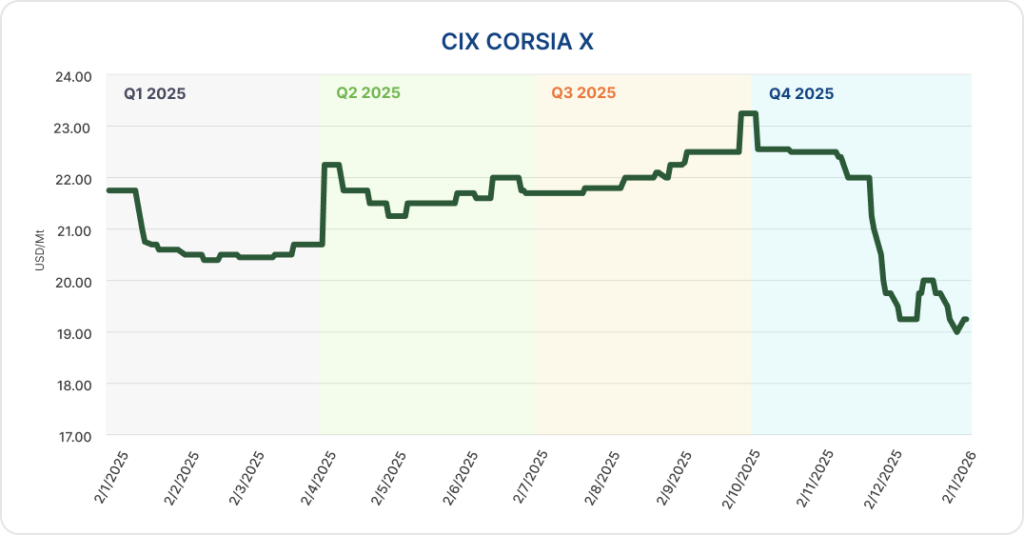
The CIX CORSIA Phase 1 X (CP1X) benchmark recorded an annual average price of US$21.45/mt in 2025. For most of the year, the CP1 market remained structurally tight, with limited spot supply and thin liquidity. As a result, benchmark movements were largely anchored to pricing for Guyana J-REDD+ (ART 102), oscillating in a $20.00-23.25/mt range from Q1 through Q3.
This dynamic shifted in November as CP1 supply diversified and new CP1-eligible credits entered the spot market. In early November, Hestian’s Malawi cookstoves (PoA GS 11677) were tagged by Gold Standard, introducing around 1.5 million credits of additional supply. This increased sell-side pressure, and the benchmark eased from the mid-$22s before breaking below $20.00/mt for the first time by the end of November.
The CP1X benchmark continued to drift lower in December. On 1 December 2025, CIX launched its first standardised spot contract for CORSIA Phase 1 (CP1X-GM), supporting more transparent on-screen price discovery. Against a backdrop of muted buying interest, the benchmark softened further and settled in the mid-to-high $19s.
The subsequent CP1 tagging of Burn’s Tanzania cookstoves credits (GS 11732) in mid-December brought further supply to market. As end-users (airlines) remained reluctant to secure sizeable volumes, the increased availability reinforced the near-term supply and demand imbalance in the spot market. As a result, the CP1X benchmark weakened into year-end and closed at a record low of $19.00/mt on the final trading day of 2025.
CIX Nature X (CNX)
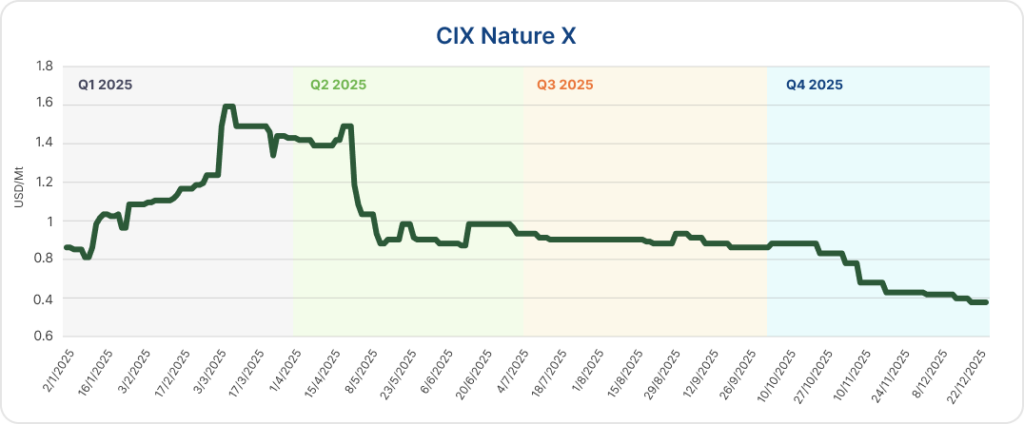
The CIX Nature X (CNX) benchmark, following Southern Cardamom v21 as the clearing project, declined over the year. The benchmark rose briefly in Q1 and Q2 to a high within the range of $1.40-1.60/mt, before declining and stabilising at around $0.90/mt throughout Q3. The benchmark softened further in Q4, reaching $0.60/mt by December.
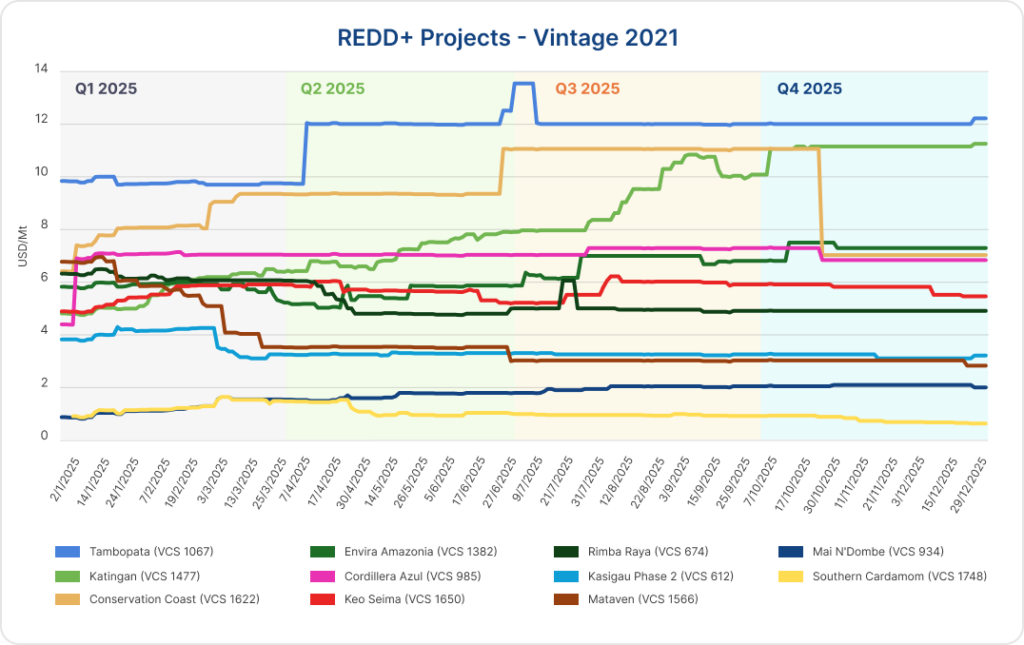
Within the CNX basket, projects firmed into three tiers of pricing**** by the end of the year:
| Tier | Price range | Projects |
|---|---|---|
| Tier 1 | >$10.00/mt | Tambopata, Katingan |
| Tier 2 | $4.00 – $10.00/mt | Envira, Conservation Coast, Cordillera, Keo Seima, Rimba Raya |
| Tier 3 | <$4.00/mt | Kasigau Phase 2, Mataven, Mai N’Dombe, Southern Cardamom |
At the start of 2025, no projects in the CNX basket were priced above $10.00/mt. By year-end, two projects – Tambopata and Katingan – had moved decisively into Tier 1.
Tambopata assessed pricing increased from just under $10.00/mt to $12.00/mt in early Q2 and remained there throughout the year, with a brief uptick in early Q3. Katingan began the year in Tier 2 at $4.88/mt and climbed steadily through the year, reaching $11.00/mt by Q4 and holding that level into year-end. In Q3, Conservation Coast briefly entered Tier 1 with pricing at $11.00/mt, but this move proved temporary with prices retreating steeply in Q4.
Notably, Katingan remained the most sought-after project within the CNX basket in 2025 and recorded the strongest price appreciation across vintages 2019-2020. For vintage 2020, transaction levels trended steadily higher over the year, rising from the high-$5s in Q1 to the high single digits by Q2, before crossing the $10.00/mt threshold in August. By the end of 2025, vintage 2020 credits were trading above $11.00/mt.
A similar trajectory was observed for vintage 2019, with transaction prices gradually increasing from the low-$5s in Q1 to $10.85/mt by December. Price strength across both vintages was supported by a tightening supply of available credits, alongside market expectations that the project would revamp its issuance process in 2026. In contrast, forward trades for yet-to-be-issued vintages 2021-2023 were heard at a discount to vintages 2019-2020, with indications below $10.00/mt, reflecting differentiated supply dynamics and delivery certainty.
Within Tier 2, where pricing lies in the $4.00-10.00/mt range, price changes were less pronounced. Envira saw the most movement, beginning the year at $6.00/mt and gradually climbing to $7.30/mt. Cordillera was broadly steady at $6.80/mt. Keo Seima also increased slightly, starting the year at $4.83/mt and increasing to $5.45/mt. Rimba Raya pricing decreased in Q1 and Q2, then steadied in the $4.80-4.90/mt range.
In Tier 3, Kasigau Phase 2 and Mataven hovered near $3.00-3.25/mt from Q2 through Q4 after a slight decline in Q1. Mai N’Dombe and Southern Cardamom both began the year near $1.00/mt, but by mid-Q2, price levels began to diverge, with Mai N’Dombe climbing to $2.00/mt and Southern Cardamom remaining depressed and decreasing to $0.60/mt.
CIX ARR X (CAX)
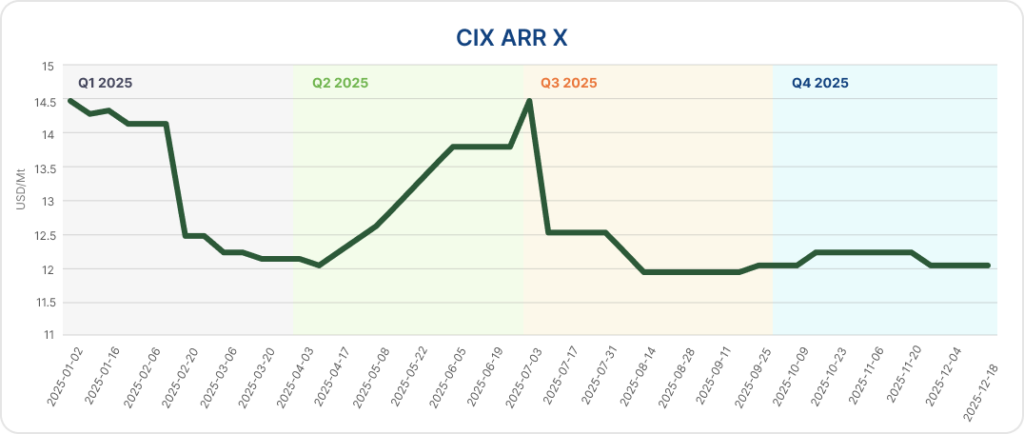
Over the course of 2025, the CIX ARR X (CAX) benchmark traded within a relatively narrow range, fluctuating between approximately $12.00/mt and $14.50/mt. The benchmark reached its annual high near the end of Q2 at $14.50/mt, before retreating and stabilising around the $12.00/mt level through the remainder of Q3 and into Q4, reflecting a cooling in buyer urgency and softer secondary demand.
Price direction in the CAX benchmark was closely anchored to developments in Verra-issued Colombia Vichada (VCS 2512), which acted as the price-setter within the CAX-eligible basket.
While Gold Standard-issued ARR credits continued to trade at a substantial premium throughout the year, their limited spot availability and lower trading frequency meant they exerted minimal influence on benchmark formation.
Within the CAX basket, the pricing spread remained wide:
| Tier | Price range | Projects |
|---|---|---|
| Tier 1 | >$40/mt, ratings band BBB-A | Nicaragua (GS 4220), Kenya/TIST (VCS 737) |
| Tier 2 | $20-40/mt, Gold Standard-issued, ratings band BB+ | Colombia (GS 4221), Panama (GS 2940) |
| Tier 3 | <$20/mt, Verra-issued, ratings band C-BB, no CCB label | Colombia (VCS 1530), Sierra Leone (VCS 2401), Colombia (VCS 2512), Ghana (VCS 987) |
Within Tier 2 and Tier 3, pricing has diverged, with Tier 2 projects such as GS Colombia Vichada increasing slightly in pricing and Tier 3 projects such as Verra Colombia Vichada decreasing in pricing. Tier 1 projects with pricing above $40.00/mt remained generally steady.
CIX Cookstoves X (CCX)
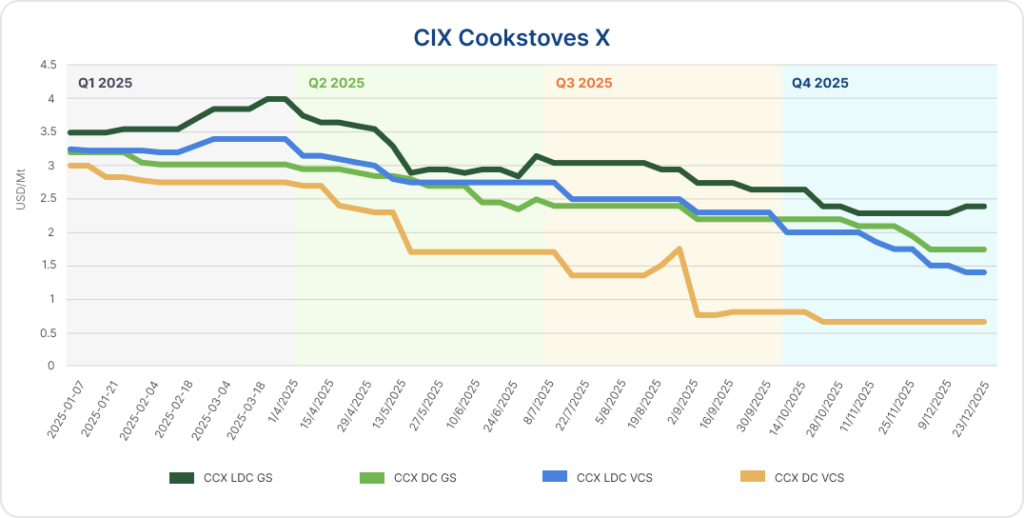
Over the course of 2025, the CIX Cookstoves X (CCX) benchmarks trended materially lower across all contract categories, with widening intra-year fragmentation driven by jurisdiction and standard.
For Verra-issued contracts, the discount for the Developing Countries Verra (CCX DC VCS) benchmark widened sharply by the end of Q3, opening a spread of more than $1.00/mt versus the Least Developed Countries Verra (CCX LDC VCS) benchmark. This divergence was primarily driven by persistent low offers for Indian cookstoves projects, which weighed heavily on the DC VCS assessment. By Q4, the spread between the two Verra benchmarks narrowed, not through a recovery in developing-country pricing, but as the LDC VCS benchmark softened to below $1.50/mt amid broader market weakness.
Gold Standard-issued benchmarks also declined quarter-over-quarter, though the pace of the sell-off was more measured. Throughout 2025, Gold Standard cookstoves maintained a structural premium over Verra-issued credits, reflecting stronger buyer preference for credits perceived to offer clearer pathways to higher-integrity use cases. That premium persisted even as absolute price levels fell, underscoring the market’s increasing differentiation by standard and project quality.
Market feedback indicates that voluntary cookstove prices in 2025 were pressured primarily by a sharp contraction in demand. Buyers increasingly turned away from credits lacking a credible line of sight to CORSIA eligibility or CCP labelling, leading to aggressive discounting – particularly in large, well-supplied developing-country markets. As a result, 2025 was characterised by a sustained repricing of cookstoves credits to reflect tightening quality thresholds and weakened compliance-adjacent demand.
Access the full report here.
* Share of activity is calculated based on the count of bids, indicative bids, offers, indicative offers, and trades recorded per project type
** Volume is calculated based on metric tonnes per trade recorded
*** Fully-approved IFM methodologies for CCP eligibility include: ACR Improved Forest Management (IFM) on Non-Federal U.S. Forestlands, v 2.1, CAR Mexico Forest Protocol, v 3.0, VM0045 Improved Forest Management Methodology Using Dynamic Matched Baselines from National Forest Inventories, v 1.2
**** Based on CIX’s calculated REDD+ outright prices
Want to dive deeper?
CIX Intelligence is a market data and analytics service for environmental markets. Designed to inform market-wide decision making and elevate price transparency, it features thousands of historical and daily updated price points, including project specific bids, offers and trades from the spot market and proprietary data from CIX venues.
The service also includes CIX’s growing suite of on-screen driven price benchmarks spanning the most active carbon market segments.
Learn more about CIX Intelligence.
For queries on specific project-level prices or benchmarks, reach out to us below.
Let’s Connect
Ready to discover the right price of carbon credits? Let’s connect.
Market Intelligence
"*" indicates required fields