







Powered by the real-time trading data in our CIX VCM Trade Database, the CIX Intelligence H1 2026 Market Pulse condenses thousands of daily price points into signals market participants need to navigate an evolving voluntary carbon landscape.
Disclaimer: This following analysis reflects a subset of market activity and is intended for indicative purposes only.
This edition of Market Pulse is structured across three sections to reflect the evolving dynamics of the carbon market in H1 2026. We begin with the non-CORSIA market, followed by a dedicated review of the CORSIA Phase 1 (CP1) market, and conclude with the CIX benchmarks we regularly report.
The separation of non-CORSIA and CORSIA markets reflects the growing divergence between these segments. While both draw from overlapping project types and supply pools, the CORSIA market is increasingly shaped by distinct compliance drivers, eligibility rules, and policy developments, which differentiate its pricing, liquidity, and buyer behaviour from the broader voluntary market.
I. Voluntary Carbon Market (Non-CORSIA)
H1 2026 Overview
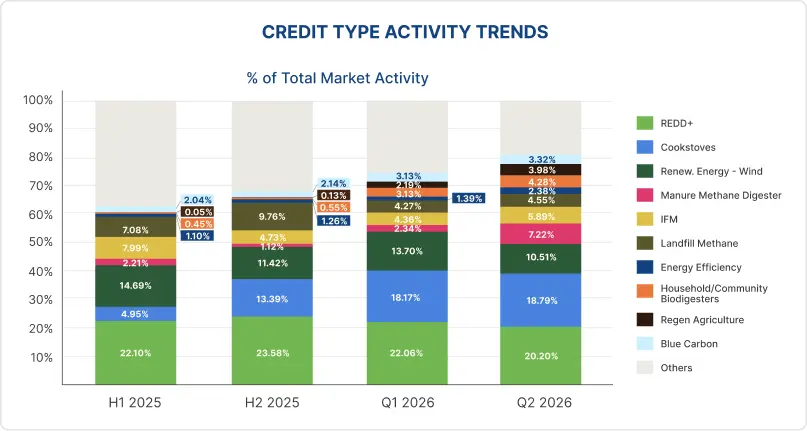
Three credit types anchored non-CORSIA market activity in H1 2026. REDD+ remained the most active segment at 21.30% of activity, followed by Cookstoves (non-CORSIA1) at 18.42% and Wind Energy at 12.43%. Together, these three accounted for roughly 52% of all recorded activity. On a combined basis, Renewable Energy (Wind, Solar, Hydropower, and Geothermal) represented around 18% of market activity.
Although activity stayed moderately concentrated at the top, it was spread across a wider set of smaller credit types than in 2025. The three most active types made up about 52% of activity and the top five around 62%, but no other single credit type cleared 5%. Below the leaders sat a broad field of smaller categories, including Improved Forest Management (IFM), Afforestation, Reforestation, and Revegetation (ARR), Methane Digester, and Blue Carbon, each holding roughly 3-5%.
Grouped by category, nature-based credits remained led by REDD+, although agriculture-linked credits gained traction. The technology-based side showed stronger shifts, including the rise of methane-abatement credits.
Nature-based project types
REDD+
This segment remained the most active in H1 2026 at 21.30% of activity, broadly in line with 22.10% a year earlier. The gradual erosion in REDD+ share seen through 2025 appears to have levelled off, holding near 21% rather than continuing to slip. Within the half it eased from 22.06% in Q1 to 20.20% in Q2, but kept its position at the top by a wide margin. Overall, this signals a stabilised segment with steady underlying demand and supply.
ARR (Afforestation, Reforestation and Revegetation)
ARR fell the most of any nature-based type, with its share dropping to 4.89% in H1 2026 from 8.43% in H1 2025. The decline ran steadily through the year, easing 3.6 percentage points from 6.37% in Q1 to 2.77% in Q2, the single largest quarterly fall anywhere in the market.
IFM (Improved Forest Management)
IFM held around 5% of activity in H1 2026, little changed year-on-year but below the elevated level it reached in late 2025. The share gain recorded in Q4 2025 did not carry through to 2026, although it moved from 4.36% in Q1 to 5.89% in Q2, modestly recovering within the half.
Technology project types
Renewable Energy
Renewable Energy (Wind, Solar, Hydropower, and Geothermal combined) showed the clearest structural change. Its share fell to around 18% in H1 2026 from roughly 29% in H1 2025, a step down from the steady 26-32% range it held across 2025, and it kept easing within the half, from 19.8% in Q1 to 15.7% in Q2. Wind remained the largest sub-type at 12.43% but fell 3.3 points quarter-on-quarter.
Cookstoves
Cookstoves was the second most active segment with 18.42% of activity in H1 2026, steady across the two quarters (18.17% in Q1, 18.79% in Q2). Its share sits well above the 4.95% recorded in H1 2025, though this category is closely linked to compliance-market developments and is best read alongside the CORSIA section rather than as a purely voluntary signal.
Methane Abatement
The methane-abatement credits, taken together Manure Methane Digesters, Landfill Methane, and Household & Community Biodigesters, held a remarkably stable share of around 12-13% of activity across H1 2025, H2 2025 and H1 2026. What changed was the composition. Manure Methane Digester recorded the single largest quarterly share gain of any credit type, rising 4.9 points from 2.34% in Q1 to 7.22% in Q2, and Biodigesters climbed from near zero a year earlier to around 3.6%. Beneath the headline share, buyer preference appears to be rotating toward specific project types within the category.
II. CORSIA Market

H1 2026 OVERVIEW
The CORSIA Phase 1 (CP1) market repriced materially lower through the first half of 2026. The CIX CP1 benchmark fell 50%, from US$19.10/tCO₂e on the first trading day of January to US$9.40/tCO₂e by mid-June, as observable bids, offers, and trades in the spot market progressively shifted down.
The decline came in distinct steps separated by periods of stability, with the sharpest resets occurring in early February and late May. The early repricing appeared to coincide with the emergence of additional CP1-labelled supply, while the later decline coincided with regulatory uncertainty around EU eligibility and potential EU ETS extension to extra-EU flights. These factors may have influenced buyer and seller behaviour in a thin market.
Price analysis in the spot market shows generic (non-project-specific) CP1 prices increasingly setting the lower end of the tradeable market, while project-specific deals often clear at a premium. Through most of H1 2026, project-specific trades cleared on average roughly 5-10% above generic trades, before that gap temporarily widened to above 30% in June as generic prices fell faster than project levels held. Generic trades stayed close to the benchmark, clearing within about 2% of it in recent months, while project-specific trades remained more widely dispersed.
The broader pattern points to a market that is still developing but gradually progressing on price discovery. Supply availability improved over the period, while demand confidence was tested by policy uncertainty. Spot contracts and benchmarks helped anchor this uneven market by identifying the lowest tradeable CP1 price, while data is increasingly available – including in CIX Intelligence products – to show what premium, if any, an individual project could achieve above that.
Benchmark Trend
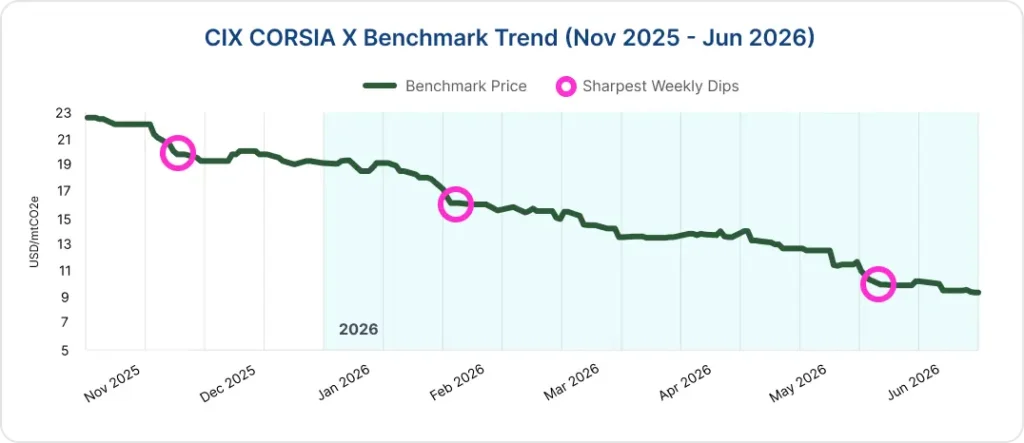
The CIX CP1 benchmark extended its downward trend from late November 2025, which marked the first clear move away from the low-US$20/tCO₂e range. After hovering in the mid-US$18/tCO₂e to low-US$19/tCO₂e by start of 2026, the benchmark started to ease late in January.
The early February reset was one of the steepest weekly drops in H1 2026, with the benchmark falling over 10% from US$17.90/tCO₂e to US$16.10/tCO₂e. It coincided with new CP1-labelled supply that broadened the mix of registries and project origins in the spot market – by the end of January, Verra had tagged its first batch of cookstove credits as eligible. The move echoed the first material repricing in late November 2025, which coincided with the first Gold Standard cookstove supply entering the market. In both cases, the additional supply likely broadened available sell-side options in an already thin market.
The largest and most sustained decline occurred in the second half of May, when the benchmark dropped around 20% from US$12.55/tCO₂e to US$10.00/tCO₂e over roughly two and a half weeks. This reset was supported by trades and offers moving into the low-US$10/tCO₂e and, later, the high-US$9/tCO₂e. The move followed a period of building regulatory uncertainty – a draft EU proposal to tighten Phase 1 eligibility for European airlines was first reported in late April, while the EU’s broader treatment of extra-EU aviation remained unresolved. The timing suggests a possible link to weaker buyer confidence, as end-users may have delayed procurement decisions while assessing eligibility and regulatory risk.
In June, the benchmark steadied around US$10/tCO₂e early in the month before easing again to US$9.40/tCO₂e by mid-month, with generic trades in the high-US$9/tCO₂e and bids slipping into the low- to mid-US$9/tCO₂e.
Pricing Dynamics
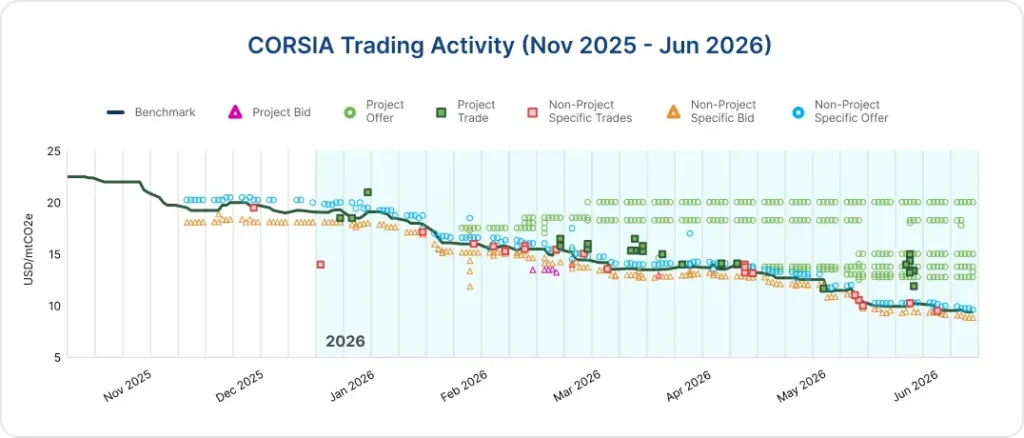
The generic bid-offer range narrowed throughout H1 2026 as benchmark prices declined.
- In January, observed bids were broadly in the high-US$17/tCO₂e to low-US$18/tCO₂e, while offers were around the low-US$19/tCO₂e to US$20/tCO₂e.
- By February and March, bids and offers had moved into the mid-teens and then the low- to mid-teens.
- By May and the first half of June, bids were mostly in the high-US$9/tCO₂e, with offers hovering in the low-US$10/tCO₂e. Data shows the bid-offer spread gradually tightened from around US$1-1.50/tCO₂e during Q1 to generally below US$1/tCO₂e by late May and early June.
The narrowing of bid-offer spread suggests that observable spot market price discovery improved over time. The benchmark generally sat inside the generic bid-offer range and often near the middle of it, with actual trades confirming the level.
Generic trades cleared close to the benchmark throughout, moving from the high-teens in January to the mid-teens in February and March, the low-teens in April, the low-US$10/tCO₂e in May, and the high-US$9/tCO₂e in June.
Project-specific trades generally carried a premium, though it compressed for much of the period as prices converged toward generic levels. Trades were recorded in the high-teens to low-US$20/tCO₂e in January, the mid-teens in March, the mid- to low-teens in April and May, and a wider range in early June. The June spread was an exception driven by a handful of projects clearing several dollars above generic trades, widening the gap sharply as generic prices found their floor.
On the offer side, project-specific offers stayed more widely dispersed. Some moved closer to generic levels, particularly certain cookstove and clean water credits, while other cookstove and jurisdictional REDD+ projects kept appearing around the upper end, in the high-teens to US$20/tCO₂e. The selling market stayed tiered, with perceived risk and buyer preference potentially carrying weight on where individual projects priced.
By late May and June, three pricing tiers had formed:
| Tier | Supply Type | Offer Price Range | Typical Projects | Description |
|---|---|---|---|---|
| Lowest Tier | Generic (non-project-specific) CP1 supply | High-US$9s to low-US$10s/tCO₂e | Cookstove and clean water projects | Closely tracked by the CP1 benchmark and represented the market floor. |
| Mid-Tier | Trade-supported project-specific supply | Low- to mid-teens/tCO₂e | Mainly cookstove credits, with some other project types | Projects that attracted a premium above generic supply while still seeing transactional support. |
| Highest Tier | Premium project-specific supply | High-teens to ~US$20/tCO₂e | Jurisdictional REDD+ and some cookstove projects | Anchored the upper end of the spot market despite broader price declines. |
Conclusion
The CP1 market became more transparent over the observed period, though pricing remained uneven and policy-sensitive. The benchmark decline reflected a move from scarcity-driven early pricing toward a market increasingly shaped by observable generic supply, tighter bid-offer ranges and trade-confirmed levels. Generic and project-specific trades have broadly converged over recent months, but a residual dispersion persists, consistent with a market still working through price discovery. At the same time, policy uncertainty kept buyer sentiment selective, with potential tightening of EU criteria for CP1 eligibility and discussion around extending EU ETS coverage weighing on procurement decisions.
As this price discovery continues to mature, the CIX CP1 benchmark and market data help participants identify where tradeable value is forming, whether and how generic and project-specific prices diverge, and how market developments are shaping the market’s evolving pricing.
III. CIX Benchmarks

Across the REDD+, ARR and Cookstove markets, CIX benchmarks were comparatively stable through the first half of 2026, with only modest downward drift and no sharp moves. Each benchmark tracks the lowest priced traded project in its respective market, following 2022 vintages for CNX (REDD+) and CAX (ARR), and 2023 vintages for the CCX Cookstove benchmarks.
REDD+: CIX Nature X (CNX)
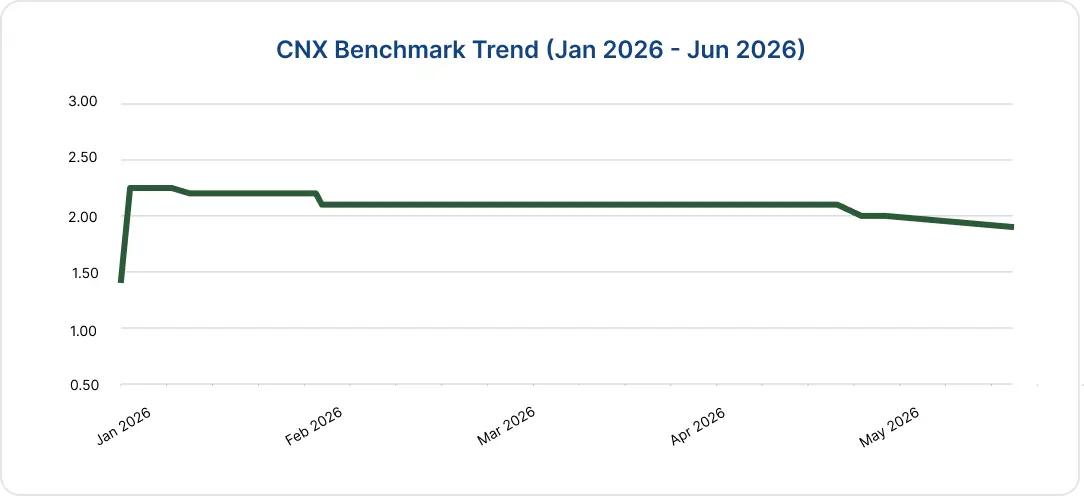
The CNX benchmark eased gradually over the period, slipping from US$2.25/tCO₂e at the start of January to US$1.90/tCO₂e by late June.
The decline was steady, with the benchmark holding around US$2.10/tCO₂e through February to April before softening in the latter weeks. The move extends the gradual decline seen across 2025, though at a slower pace, consistent with a REDD+ market that stayed soft without coming under fresh downward pressure.
ARR: CIX ARR X (CAX)
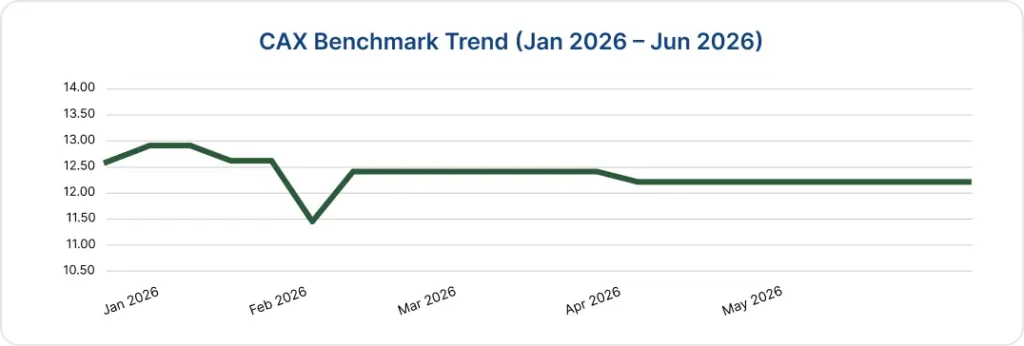
CAX was the steadiest benchmark, holding in a narrow band around US$12.20-12.90/tCO₂e throughout the period. After easing modestly from US$12.90/tCO₂e in early January, it settled at US$12.20/tCO₂e from April through late May. A single lower print near US$11.44/tCO₂e in early February did not persist, recovering the following week. The stability reflects the muted activity seen across the broader ARR market in H1 2026
CIX Cookstoves X (CCX)
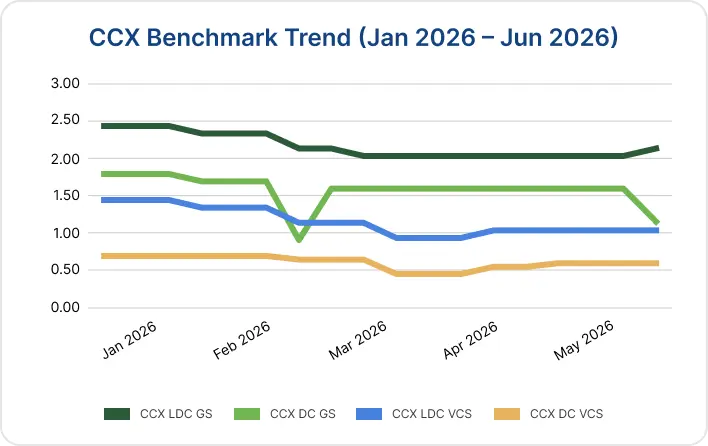
The four CCX benchmarks, set across a matrix of jurisdiction (Least Developed Country and Developing Country) and standard (Gold Standard and Verra), all drifted modestly lower over the period while preserving their relative ordering. Gold Standard (GS) contracts stayed above Verra (VCS), and Least Developed Country (LDC) contracts above Developing Country (DC) contracts, so the standard and jurisdiction premiums that defined the cookstove market in 2025 carried into 2026.
CCX LDC GS, the highest of the four, eased from US$2.45/tCO₂e to around US$2.05-2.15/tCO₂e. CCX DC GS softened from US$1.80/tCO₂e toward US$1.15-1.60/tCO₂e. On the Verra side, CCX LDC VCS drifted from US$1.45/tCO₂e to around US$1.05/tCO₂e, and CCX DC VCS, the lowest of the four throughout, held near US$0.60-0.70/tCO₂e. Both developing-country benchmarks recorded brief single-week dips in late February and mid-March that did not hold, consistent with thin liquidity at the lower end of the non-CORSIA cookstove market.
Access the full report here.
[1] This analysis excludes any prices associated with cookstove credits that have already obtained CORSIA Phase 1 eligibility. It may, however, still include forward-looking deals for credits that could obtain that eligibility in the future.
Want to dive deeper?
CIX Intelligence is a market data and analytics service for environmental markets. Designed to inform market-wide decision making and elevate price transparency, it features thousands of historical and daily updated price points, including project specific bids, offers and trades from the spot market and proprietary data from CIX venues.
The service also includes CIX’s growing suite of on-screen driven price benchmarks spanning the most active carbon market segments.
Learn more about CIX Intelligence.
For queries on specific project-level prices or benchmarks, reach out to us below.
Let’s Connect
Ready to discover the right price of carbon credits? Let’s connect.
Market Intelligence
"*" indicates required fields